Difference between revisions of "Equal Loudness"
(removed ref to Fletcher Munson curves) |
m |
||
| (4 intermediate revisions by the same user not shown) | |||
| Line 1: | Line 1: | ||
| − | Equal Loudness Curves | + | [[Image:EqualLoudness400px-Lindos1.svg.png|right]] |
| + | |||
| + | In many discussions on the {{forum}} you will see references to Equal Loudness Curves (Contours). For the performing musician, this means that what you hear at relatively low levels may differ significantly when you turn up the volume. The difference will be more than volume, it will be in the spectral balance (your tone) of what you hear. | ||
| + | |||
| + | Specifically, if you create your tone for voice or instrument at low levels, when you turn it up for performance what you will hear will be louder but also significantly different with respect to the tone. | ||
| + | |||
| + | Here is an excerpt from [http://en.wikipedia.org/wiki/Equal-loudness_contour Wikipedia] | ||
| + | |||
| + | An '''equal-loudness contour''' is a measure of sound pressure ([http://en.wikipedia.org/wiki/Decibel dB] [http://en.wikipedia.org/wiki/Sound_pressure_level SPL]), over the [http://en.wikipedia.org/wiki/Frequency frequency] spectrum, for which a listener perceives a constant loudness when presented with pure steady tones. The unit of measurement for loudness levels is the [http://en.wikipedia.org/wiki/Phon phon], and is arrived at by reference to equal-loudness contours. By definition two sine waves, of differing frequencies, are said to have equal-loudness level measured in phons if they appear equally loud to the average young person without significant hearing impairment. | ||
| + | |||
| + | Equal-loudness contours are often referred to as 'Fletcher-Munson' curves, after the earliest experimenters, but this is now incorrect, the definitive curves being those defined in the international standard ISO 226:2003 which are based on a review of several modern determinations made in various countries. | ||
| + | |||
| + | == Experimental determination== | ||
| + | |||
| + | The human auditory system is sensitive to frequencies from 20 Hz to a maximum of around 20,000 Hz, although the hearing range decreases with age. Within this range, the human ear is most sensitive between 1 and 5 kHz, largely due to the resonance of the ear canal and the transfer function of the ossicles of the middle ear. | ||
| + | |||
| + | Equal-loudness contours were first measured by Fletcher and Munson using headphones (1933). In their study, listeners were presented with pure tones at various frequencies and over 10 dB increments in stimulus intensity. For each frequency and intensity, the listener was also presented with a reference tone at 1000 Hz. The reference tone was adjusted until it was perceived to be of the same loudness as the test tone. Loudness, being a psychological quantity, is difficult to measure, so [http://en.wikipedia.org/wiki/Fletcher-Munson_curves Fletcher and Munson] averaged their results over many test subjects to derive reasonable averages. The lowest equal-loudness contour represents the quietest audible tone and is also known as the [http://en.wikipedia.org/wiki/Absolute_threshold_of_hearing absolute threshold of hearing]. The highest contour is the [http://en.wikipedia.org/wiki/Threshold_of_pain threshold of pain]. | ||
| + | |||
| + | A new experimental determination was made by [http://en.wikipedia.org/wiki/Robinson-Dadson_curves Robinson and Dadson] (1956) which was believed to be more accurate, and this became the basis for a standard (ISO 226) which was considered definitive until 2003, when the standard was revised on the basis of recent assessments by research groups worldwide. | ||
| + | |||
| + | == Recent revision aimed at more precise determination - ISO 226:2003 == | ||
| + | |||
| + | Because of perceived discrepancies between early and more recent determinations, the [http://en.wikipedia.org/wiki/International_Organization_for_Standardization International Organization for Standardization] (ISO) recently revised its standard curves as defined in ISO 226, in response to the recommendations of a study coordinated by the Research Institute of Electrical Communication, Tohoku University, Japan. The study produced new curves by combining the results of several studies, by researchers in Japan, Germany, Denmark, UK, and USA. (Japan was the greatest contributor with about 40% of the data.) This has resulted in the recent acceptance of a new set of curves standardized as ISO 226:2003. The report comments on the surprisingly large differences, and the fact that the original Fletcher-Munson contours are in better agreement with recent results than the Robinson-Dadson, which appear to differ by as much as 10–15 dB especially in the low-frequency region, for reasons that are not explained.[http://www.nedo.go.jp/itd/grant-e/report/00pdf/is-01e.pdf] | ||
| + | |||
| + | --- Read the whole article: [http://en.wikipedia.org/wiki/Equal-loudness_contour Equal-loudness contour, in Wikipedia] | ||
| + | |||
| + | |||
| + | |||
| + | ''' Earlier Notes ''' | ||
| + | |||
| + | |||
| + | |||
[[Image:EqualLoudness.gif|Equal Loudness Curves|right]] | [[Image:EqualLoudness.gif|Equal Loudness Curves|right]] | ||
| − | "You will see lots of references to equal loudness curves or equal loudness contours- these are based on the work of Fletcher and Munson at Bell labs in the 30s, or perhaps refinements made more recently by Robinson and Dadson. These were made by asking people to judge when pure tones of two different frequencies were the same loudness. This is a very difficult | + | "You will see lots of references to equal loudness curves or equal loudness contours- these are based on the work of Fletcher and Munson at Bell labs in the 30s, or perhaps refinements made more recently by Robinson and Dadson. These were made by asking people to judge when pure tones of two different frequencies were the same loudness. This is a very difficult judgement to make, and the curves are the average results from many subjects, so they should be considered general indicators rather than a prescription as to what a single individual might hear" |
- [http://arts.ucsc.edu/EMS/Music/tech_background/TE-02/AcNumbers/AcNumbers.html Numbers and Initials of Acoustics] | - [http://arts.ucsc.edu/EMS/Music/tech_background/TE-02/AcNumbers/AcNumbers.html Numbers and Initials of Acoustics] | ||
| Line 11: | Line 42: | ||
http://hyperphysics.phy-astr.gsu.edu/hbase/sound/eqloud.html | http://hyperphysics.phy-astr.gsu.edu/hbase/sound/eqloud.html | ||
| − | [[Presets_2.0/Cliff_Notes#Prerecorded_Music|Preset Version 2.0 #57]] | + | [[Presets_2.0/Cliff_Notes#Prerecorded_Music|Preset Version 2.0 #57]] - the description of Version 2 Preset #57 makes reference to Equal Loudness Curves |
Latest revision as of 11:27, 8 November 2007
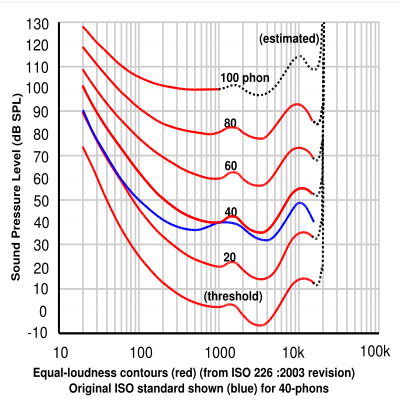
In many discussions on the Bose® Pro Portable PA Community you will see references to Equal Loudness Curves (Contours). For the performing musician, this means that what you hear at relatively low levels may differ significantly when you turn up the volume. The difference will be more than volume, it will be in the spectral balance (your tone) of what you hear.
Specifically, if you create your tone for voice or instrument at low levels, when you turn it up for performance what you will hear will be louder but also significantly different with respect to the tone.
Here is an excerpt from Wikipedia
An equal-loudness contour is a measure of sound pressure (dB SPL), over the frequency spectrum, for which a listener perceives a constant loudness when presented with pure steady tones. The unit of measurement for loudness levels is the phon, and is arrived at by reference to equal-loudness contours. By definition two sine waves, of differing frequencies, are said to have equal-loudness level measured in phons if they appear equally loud to the average young person without significant hearing impairment.
Equal-loudness contours are often referred to as 'Fletcher-Munson' curves, after the earliest experimenters, but this is now incorrect, the definitive curves being those defined in the international standard ISO 226:2003 which are based on a review of several modern determinations made in various countries.
Experimental determination
The human auditory system is sensitive to frequencies from 20 Hz to a maximum of around 20,000 Hz, although the hearing range decreases with age. Within this range, the human ear is most sensitive between 1 and 5 kHz, largely due to the resonance of the ear canal and the transfer function of the ossicles of the middle ear.
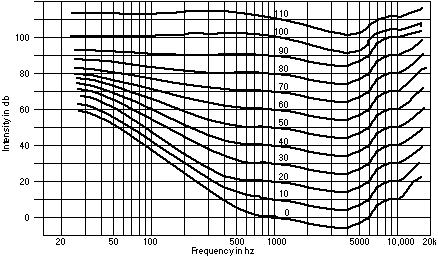
Equal-loudness contours were first measured by Fletcher and Munson using headphones (1933). In their study, listeners were presented with pure tones at various frequencies and over 10 dB increments in stimulus intensity. For each frequency and intensity, the listener was also presented with a reference tone at 1000 Hz. The reference tone was adjusted until it was perceived to be of the same loudness as the test tone. Loudness, being a psychological quantity, is difficult to measure, so Fletcher and Munson averaged their results over many test subjects to derive reasonable averages. The lowest equal-loudness contour represents the quietest audible tone and is also known as the absolute threshold of hearing. The highest contour is the threshold of pain.
A new experimental determination was made by Robinson and Dadson (1956) which was believed to be more accurate, and this became the basis for a standard (ISO 226) which was considered definitive until 2003, when the standard was revised on the basis of recent assessments by research groups worldwide.
Recent revision aimed at more precise determination - ISO 226:2003
Because of perceived discrepancies between early and more recent determinations, the International Organization for Standardization (ISO) recently revised its standard curves as defined in ISO 226, in response to the recommendations of a study coordinated by the Research Institute of Electrical Communication, Tohoku University, Japan. The study produced new curves by combining the results of several studies, by researchers in Japan, Germany, Denmark, UK, and USA. (Japan was the greatest contributor with about 40% of the data.) This has resulted in the recent acceptance of a new set of curves standardized as ISO 226:2003. The report comments on the surprisingly large differences, and the fact that the original Fletcher-Munson contours are in better agreement with recent results than the Robinson-Dadson, which appear to differ by as much as 10–15 dB especially in the low-frequency region, for reasons that are not explained.[1]
--- Read the whole article: Equal-loudness contour, in Wikipedia
Earlier Notes
"You will see lots of references to equal loudness curves or equal loudness contours- these are based on the work of Fletcher and Munson at Bell labs in the 30s, or perhaps refinements made more recently by Robinson and Dadson. These were made by asking people to judge when pure tones of two different frequencies were the same loudness. This is a very difficult judgement to make, and the curves are the average results from many subjects, so they should be considered general indicators rather than a prescription as to what a single individual might hear" - Numbers and Initials of Acoustics
See also:
http://www.sfu.ca/sonic-studio/handbook/Equal_Loudness_Contours.html
http://hyperphysics.phy-astr.gsu.edu/hbase/sound/eqloud.html
Preset Version 2.0 #57 - the description of Version 2 Preset #57 makes reference to Equal Loudness Curves

