Difference between revisions of "T1 ToneMatch® Audio Engine / Para EQ"
(first ed images only) |
m (added text) |
||
| Line 1: | Line 1: | ||
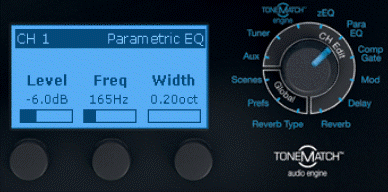
Understanding the {{T1}} Para EQ | Understanding the {{T1}} Para EQ | ||
| − | |||
| + | Starting with the {{T1}} looking like this | ||
| − | [[Image: | + | [[Image:T1ParaEQSettings.png]] |
| + | imagine that we are increasing the Width parameter. | ||
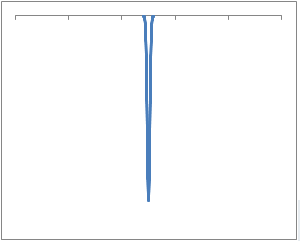
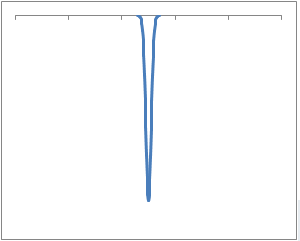
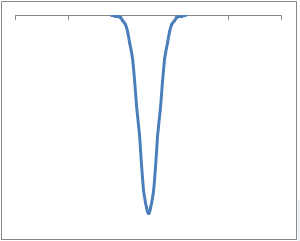
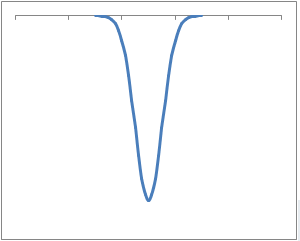
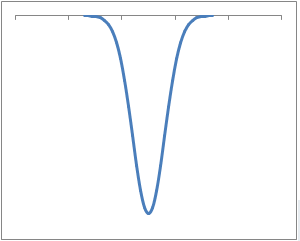
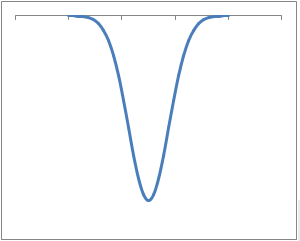
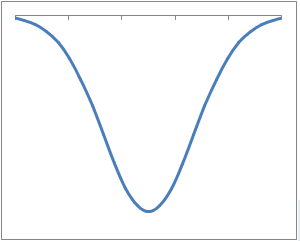
| + | In the plots below the centre point (lowest representing -6dB ) is the Frequency that you select with the middle button, in this case 165 Hz (E3, not shown in the Simulator). The tick marks on the X-axis are roughly 1 octave. I have deliberately omitted actual frequencies because I wanted to give you a sense of relative differences rather than suggest that this is what is actually happening. | ||
| − | + | The plots below suggest the widening range of notes that will be affected by the Level (-6 dB) as we go increase the Width. The plots point down because we are applying a *negative* level. The depth of the plot (distance down) would vary up and down as we changed the Level. | |
| + | The following are extremely rough approximations. For anyone reading - there is nothing scientific about these plots. The appearance suggests a level of precision that is way beyond what I did to create these images. (Normal distribution curve, manipulated the standard deviation). Just go for the rough visual impression. Thanks! | ||
| − | |||
| + | [[Image:T1ParaEQWidth-02.png|thumb|Width = 0.2 Octave (0.2 Octave (0.10 Octave on either side of the Freq)]] | ||
| − | |||
| + | [[Image:T1ParaEQWidth-05.png|thumb|Width = 0.5 Octave (0.5 Octave (0.25 Octave on either side of the Freq)]] | ||
| − | |||
| − | [[Image:T1ParaEQWidth-50.png| | + | [[Image:T1ParaEQWidth-10.png|thumb|Width = 1.0 Octave (1.0 Octave (0.50 Octave on either side of the Freq)]] |
| + | |||
| + | |||
| + | [[Image:T1ParaEQWidth-15.png|thumb|Width = 1.5 Octaves (1.5 Octaves (0.75 Octave on either side of the Freq)]] | ||
| + | |||
| + | |||
| + | [[Image:T1ParaEQWidth-20.png|thumb|Width = 2.0 Octaves (2.0 Octaves (1.00 Octaves on either side of the Freq)]] | ||
| + | |||
| + | |||
| + | [[Image:T1ParaEQWidth-25.png|thumb|Width = 2.5 Octaves (1.25 Octaves on either side of the Freq)]] | ||
| + | |||
| + | [[Image:T1ParaEQWidth-50.png|thumb|Width = 5.0 Octaves (2.50 Octaves on either side of the Freq)]] | ||
Revision as of 23:09, 27 October 2007
Understanding the T1 ToneMatch Audio Engine Para EQ
Starting with the T1 ToneMatch Audio Engine looking like this
imagine that we are increasing the Width parameter. In the plots below the centre point (lowest representing -6dB ) is the Frequency that you select with the middle button, in this case 165 Hz (E3, not shown in the Simulator). The tick marks on the X-axis are roughly 1 octave. I have deliberately omitted actual frequencies because I wanted to give you a sense of relative differences rather than suggest that this is what is actually happening.
The plots below suggest the widening range of notes that will be affected by the Level (-6 dB) as we go increase the Width. The plots point down because we are applying a *negative* level. The depth of the plot (distance down) would vary up and down as we changed the Level.
The following are extremely rough approximations. For anyone reading - there is nothing scientific about these plots. The appearance suggests a level of precision that is way beyond what I did to create these images. (Normal distribution curve, manipulated the standard deviation). Just go for the rough visual impression. Thanks!
